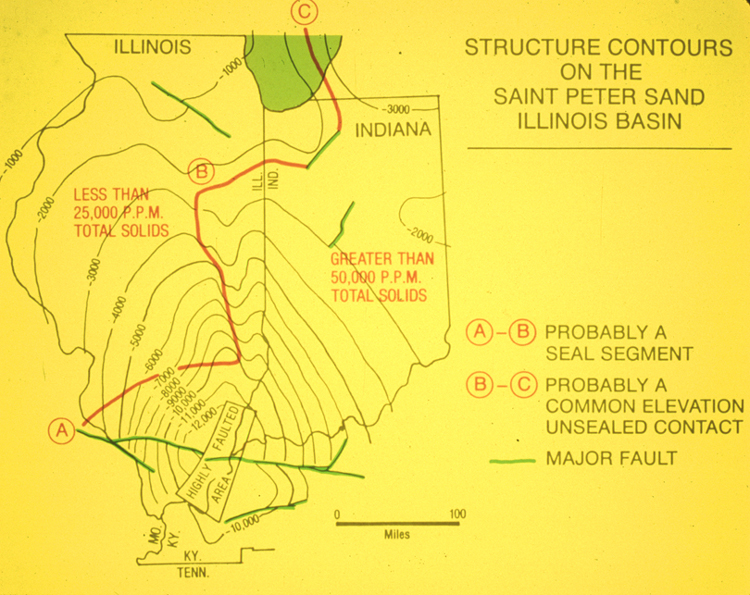
Figure 19. Structural contour map, on St. Peter Sandstone, Illinois basin, with boundary separating salinities of less than 25,000 ppm from salinities of greater than 50,000 ppm.
Figure 19. Structural contour map, on St. Peter Sandstone, Illinois basin, with boundary separating salinities of less than 25,000 ppm from salinities of greater than 50,000 ppm.