Click on image for larger version.
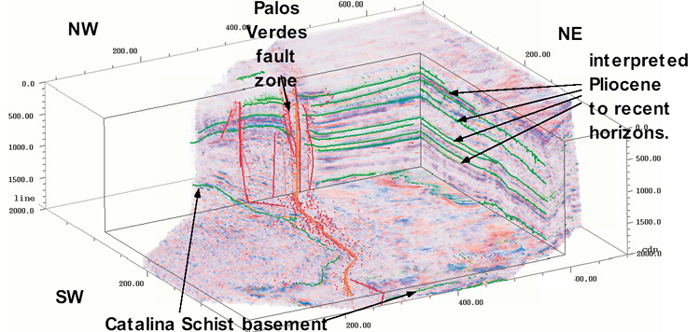
Figure 2. Chair-cut visualization of Beta oil field 3D survey, cut at line 120, CDP 650, and time 1800 ms. Positive amplitudes are in red; negative amplitudes, in blue. The general northwest trend of the fault zone with its pop-up structure is visible and separates the volume into two distinct seismic characters with Palos Verde anticlinorium to the west and Wilmington “graben” to the east. Note the complex structure of the fault zone, which includes multiple fault strands. Additionally, several Pliocene to Quaternary horizons have been added.

