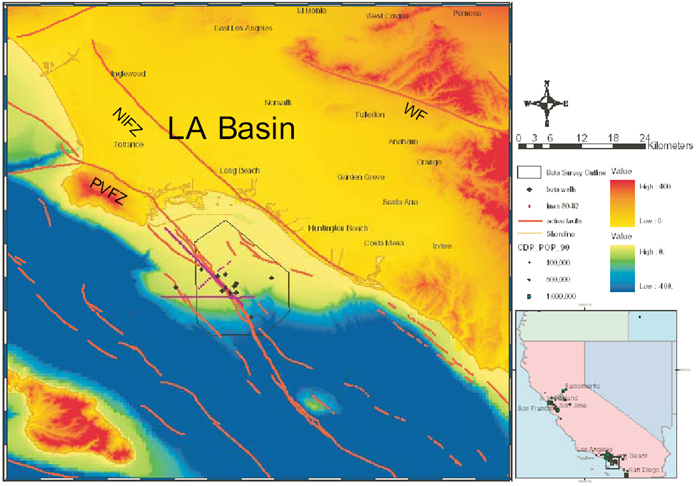
Click on image for larger version.
Figure 1. Index map. The box on the inset map shows the location of the Palos Verdes fault and study area. The polygon shows the area of the 3D seismic data. Lines in violet show the 2D seismic profile locations. Mapped faults are in red. Note changes in bathymetry associated with bends in the Palos Verde fault (PVFZ). Similarly, the topography changes along the Newport-Inglewood ((NIFZ) and Whittier (WF) faults, the other two major right-slip faults of the Los Angeles Basin (LA Basin).

