GCCauses and Appearance of Noise in ![]() Seismic
Seismic![]() Data Volumes*
Data Volumes*
Satinder Chopra¹ and Kurt J. Marfurt²
Search and Discovery Article #41476 (2014)
Posted November 3, 2014
*Adapted from the Geophysical Corner column, prepared by the authors, in AAPG Explorer, October, 2014. Editor of Geophysical Corner is Satinder Chopra ([email protected]). Managing Editor of AAPG Explorer is Vern Stefanic.
¹Arcis ![]() Seismic
Seismic![]() Solutions, TGS, Calgary, Canada ([email protected])
Solutions, TGS, Calgary, Canada ([email protected])
²University of Oklahoma, Norman, Oklahoma
![]() Seismic
Seismic![]() data are usually contaminated with noise, which refers to any unwanted features in the data. These unwanted features may actually be somebody else's signal, such as converted waves in what we think of as "P-wave" data – but more commonly, these unwanted "noise" features provide little or no information about the subsurface, and are referred to as random noise and coherent noise. Examples of random noise include wave action in a marine environment, wind and vehicle traffic in a land environment, and electronic instrument noise in both environments.
data are usually contaminated with noise, which refers to any unwanted features in the data. These unwanted features may actually be somebody else's signal, such as converted waves in what we think of as "P-wave" data – but more commonly, these unwanted "noise" features provide little or no information about the subsurface, and are referred to as random noise and coherent noise. Examples of random noise include wave action in a marine environment, wind and vehicle traffic in a land environment, and electronic instrument noise in both environments.
There are two types of coherent noise:
On processed data, noise that looks random in time may be highly organized in space – such as acquisition footprint, which is highly correlated to the acquisition geometry. The least ambiguous but most difficult to address type of "noise" is the total absence of signal, such as dead traces and lower-fold areas corresponding to the unrecorded offsets and azimuths. Whatever their cause, all these types of ![]() seismic
seismic![]() noise can result in significant artifacts that may negatively impact subsequent interpretation products, from simple structural and spectral attributes through prestack impedance inversion, to AVAz analysis.
noise can result in significant artifacts that may negatively impact subsequent interpretation products, from simple structural and spectral attributes through prestack impedance inversion, to AVAz analysis.
|
♦General statement ♦Figures ♦Suppression of noise ♦Examples ♦Conclusions
♦General statement ♦Figures ♦Suppression of noise ♦Examples ♦Conclusions
♦General statement ♦Figures ♦Suppression of noise ♦Examples ♦Conclusions
♦General statement ♦Figures ♦Suppression of noise ♦Examples ♦Conclusions
♦General statement ♦Figures ♦Suppression of noise ♦Examples ♦Conclusions
♦General statement ♦Figures ♦Suppression of noise ♦Examples ♦Conclusions
♦General statement ♦Figures ♦Suppression of noise ♦Examples ♦Conclusions
♦General statement ♦Figures ♦Suppression of noise ♦Examples ♦Conclusions
♦General statement ♦Figures ♦Suppression of noise ♦Examples ♦Conclusions
♦General statement ♦Figures ♦Suppression of noise ♦Examples ♦Conclusions
♦General statement ♦Figures ♦Suppression of noise ♦Examples ♦Conclusions |
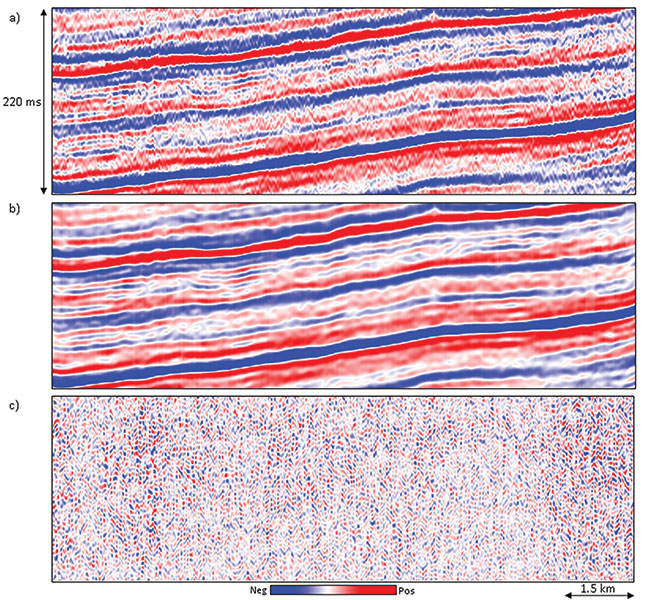
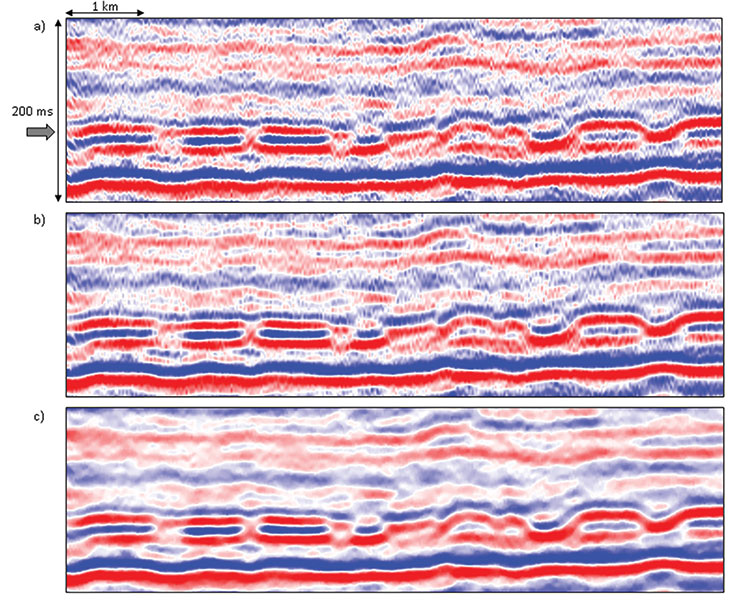
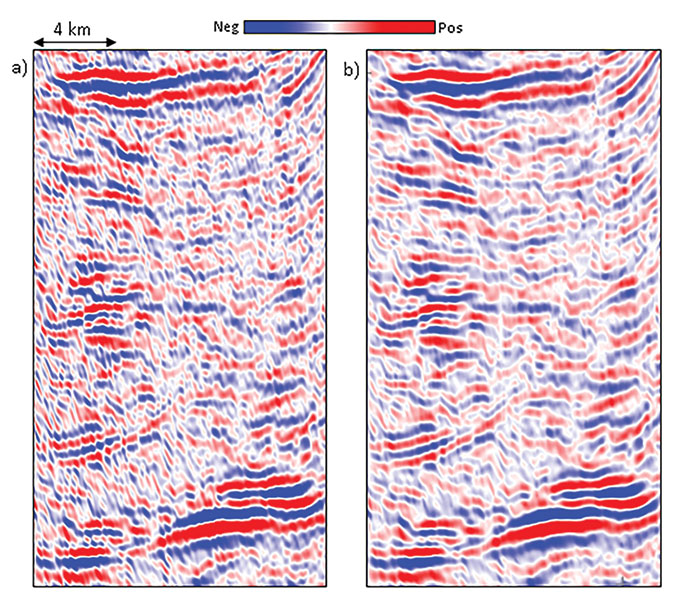
Of all the types of noise, random noise – or coherent noise that appears random – is the easiest to suppress. The mean filter is the simplest and most familiar noise suppression filter. These filters simply represent the arithmetic running average of a given number of spatial samples, usually "3" for 2-D data or "5" for 3-D. Larger filters are most efficiently implemented by cascading, or reapplying, the filter to a previously filtered version of the data multiple times. Mean filters can be directly applied to time structure maps and horizon slices through In contrast, a structure-oriented median filter not only suppresses random noise, but will preserve lateral reflector discontinuities. The median filter picks up samples within the chosen aperture along the local dip and azimuth and replaces the amplitude of the central sample position with the median value of the amplitudes. Principal component filters go one step further by using more than the five (or more) samples along structure dip and azimuth, but also a suite of 2K parallel five-sample slices above and below the target sample. Mathematically, the principal component generates a five-sample pattern that best represents the lateral variation in amplitude along the 2K+1 slices. In the absence of high amplitude artifacts in the data in general, the principal component filter accurately preserves lateral changes in The simplest way to preserve edges is to simply compute the location of the edges using a coherence or Sobel filter algorithm sensitive to discontinuities. The desired filter is then applied only to those areas where the coherence falls above some user-defined value. A slightly more complicated way to preserve edges is to evaluate the standard deviation (or alternatively, the coherence) in a suite of overlapping windows that include the analysis point. Then the mean, median, principal component or other filter is computed in the window with the smallest standard deviation or coherence and mapped to the desired sample. We show the application of a principal component structure-oriented filtering to a data volume through a representative As seen in Figure 1c, there are no reflection events that have been rejected. Instead, we see random noise as well as inclined broken noise patterns. This steeply dipping noise is common to most Modern "high density" acquisition directly addresses these sampling problems and results in superior images for the interpreter. Structure-oriented filtering is widely used in the industry and has also found its way into most commercial workstation interpretation software packages. It usually works fine in most cases, and so the interpreters tend to use it all the time, irrespective of the quality of the input In this example, the edge-preserving, structure-oriented filtering was run with the default parameters in a popular commercial In Figure 3a, we show a small segment of a If the surface data are coarsely sampled, the steeper limbs of the smiles fail to destructively interfere resulting in the steeply dipping artifacts seen in Figure 1 and Figure 2. If the data goes abruptly to zero, such as at the edge of a survey or in a no-permit zone, there are no additional smiles to destructively interfere, leaving the edge effects seen in Figure 3. High amplitude spikes present in the data also generate smiles, which appear as a number of small amplitude bursts scattered throughout the section in a random way. This is clearly seen on the zoom of a small portion of the section shown in Figure 3b. When such amplitude bursts, or spikes are randomly present in the data, principal component structure-oriented filtering may not be the best way to enhance S/N ratio. In Figure 4a we show a segment of a section from In the extreme case where one of the traces is a high amplitude spike, the most energetic pattern will be the value 1.0 at the spike trace location and zero at the other locations. Counterintuitively, the principal component filter in this case will preserve the noise and reject the signal. The data in Figure 4 are not quite this bad, but have sufficiently high amplitude noise that it contaminates the pattern. In contrast, the non-linear median filter is constructed to reject anomalously strong negative and positive spikes, resulting in the improved image in Figure 4c. The coherence Dipping Noise Steeply dipping noise, sometimes due to shallow backscattered ground roll can also riddle Acquisition Footprint Acquisition footprint refers to linear spatial grid patterns seen on 3-D In land data, acquisition footprint often results in In Figure 7 we show the application of both principal component and median filters on One way to suppress the footprint is to first analyze the pattern in the kx-ky wavenumber domain, and then design filters to remove the unwanted patterns. Of course, one runs the risk of also removing the authentic signatures of fractures in the data that have the same orientation as the footprint, and so such filtering needs to be applied with care. We show one such application in Figure 8, where the most-positive curvature time slices are shown from the input The equivalent display from the most positive curvature (long-wavelength) computed on the footprint-filtered version of the Regularization of
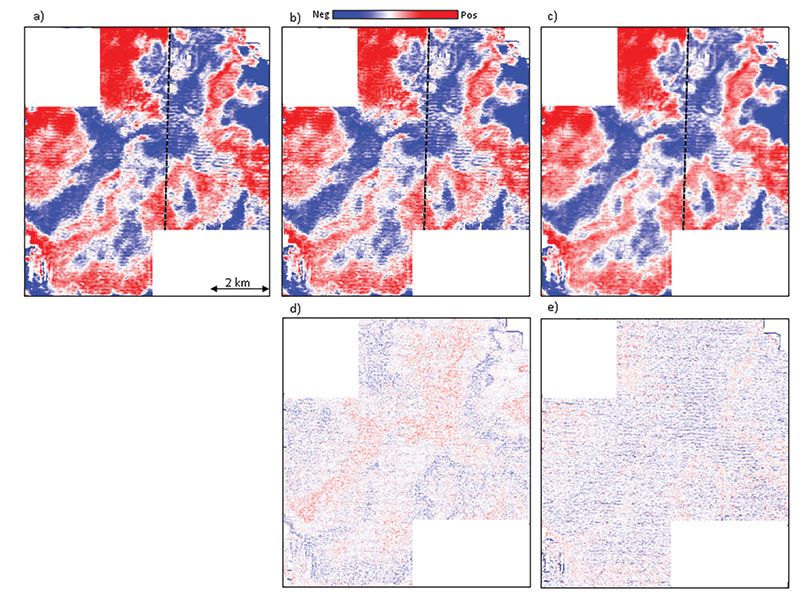
The second best approach is to handle the missing data problem in the processing center. Originally, single or a local few missing data traces can be handled by copying adjacent traces to into the CMP bin. Such simplistic methods were superseded by 2-D and later 3-D triangular trace interpolation methods. All these methods use the local data to predict the missing data and so are called local methods. They do have a limitation in that they cannot handle large data gaps. In the last decade or so, global methods for data interpolation have evolved that use more of the available data to populate the missing data. These methods are multidimensional instead of one-, two- or three-dimensional, operating simultaneously in as many as five different spatial dimensions (e.g. inline, crossline, offset, azimuth and frequency), and are able to predict the missing data with more accurate amplitude and phase behavior. As might be expected, these methods are compute intensive and have longer runtimes than the local methods. Such 5-D interpolation methods regularize the offset and azimuth distribution in bins, and hence the simulated acquisition geometry of the Similarly, the speckled pattern corresponding to the missing traces on the coherence volume before 5-D interpolation is gone, and the coherence display is amenable to much better interpretation after 5-D interpolation. In Figure 10a we show time slices at t=158 ms, where the acquisition footprint appears prominently on the coherence
Random noise may be handled using principal component structure-oriented filters, but when spikes or sharp amplitude bursts are present, they could be handled better with nonlinear structure-oriented median filters. Inclined coherent noise can be handled with dip filtering. Acquisition footprint or missing data issues arising out of non-uniformity in the geometry of the |