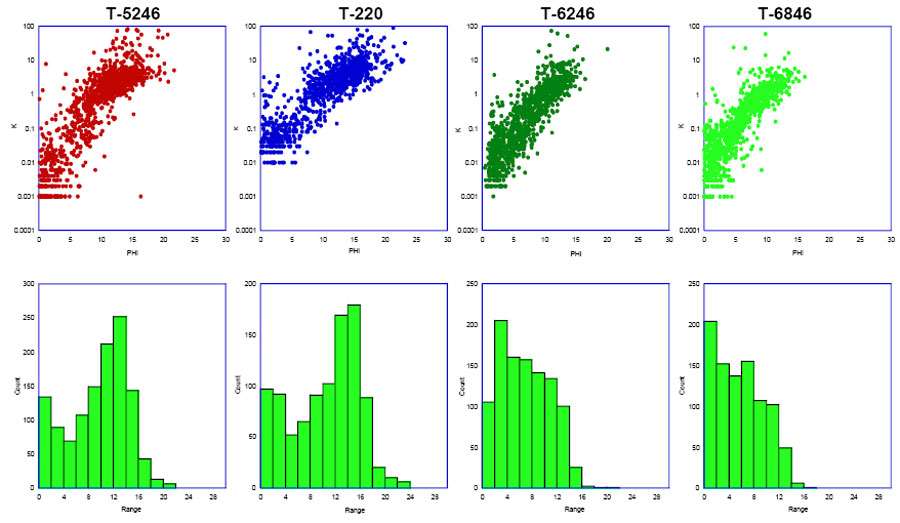
K-Phi plots and porosity histograms suggest different behavior between northern central platform wells (T-220 and T-5246) and southern central platform wells (T-6246 and T-6846) with generally lower mean porosities and better behaved permeability-porosity relationships in the southern wells and bimodal porosity distributions in the northern wells.